SRS Stanford Research Systems - SR760 - Spectrum analyzer
Manufacturer:
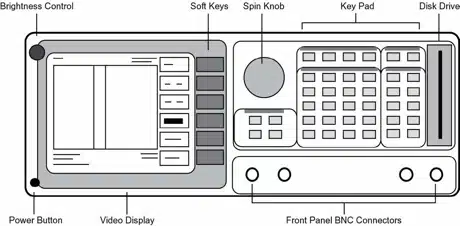
Image 1 of 1
If you have any other photos or manuals for the
SRS Stanford Research Systems SR760
you can
upload the files here.
Equipment:
SR760
Date:
2001
Category:
Group:
Sub Group:
Information
FREQUENCY
Measurement Range 476 μHz to 100 kHz, baseband and zoomed.
Spans 191 mHz to 100 kHz in a binary sequence.
Center Frequency Anywhere within the measurement range
subject to span and range limits.
Accuracy 25 ppm from 20°C to 40°C.
Resolution Span/400
Window Functions Blackman-Harris, Hanning, Flattop and Uniform.
Real-time Bandwidth 100 kHz
SIGNAL INPUT
Number of Channels 1
Input Single-ended or true differential
Input Impedance 1 MΩ, 15 pf
Coupling AC or DC
CMRR 90 dB at 1 kHz (Input Range < -6 dBV)
80 dB at 1 kHz (Input Range <14 dBV)
50 dB at 1 kHz (Input Range ≥ 14 dBV)
Noise 5 nVrms/√Hz at 1 kHz typical, 10 nVrms/√Hz max.
(-166 dBVrms/√Hz typ., -160 dBVrms/√Hz max.)
AMPLITUDE
Full Scale Input Range -60 dBV (1.0 mVpk) to +34 dBV (50
Vpk) in 2 dB steps.
Dynamic Range 90 dB typical
Harmonic Distortion No greater than -80 dB from DC to 100
kHz. (Input Range ≤ 0 dBV)
Spurious Input range ≥ -50 dBV:
No greater than -85 dB below full scale below 200 Hz.
No greater than -90 dB below full scale to 100 kHz.
Input Sampling 16 bit A/D at 256 kHz
Accuracy ± 0.3 dB ± 0.02% of full scale (excluding windowing
effects).
Averaging RMS, Vector and Peak Hold.
Linear and exponential averaging up to 64k scans.
TRIGGER INPUT
Modes Continuous, internal, external, or external TTL.
Internal Level: Adjustable to ±100% of input scale.
Positive or Negative slope.
Minimum Trigger Amplitude: 10% of input range.
External Level: ±5V in 40 mV steps. Positive or Negative slope.
Impedance: 10 kΩ
Minimum Trigger Amplitude: 100 mV.
External TTL Requires TTL level to trigger (low<.7V, high>2V).
Post-Trigger Measurement record is delayed by 1 to 65,000
samples (1/512 to 127 time
records) after the trigger.
Delay resolution is 1 sample (1/512 of a record).
Pre-Trigger Measurement record starts up to 51.953 ms prior
to the trigger.
Delay resolution is 3.9062 μs.
Phase Indeterminacy <2°
DISPLAY FUNCTIONS
Display Real, imaginary, magnitude or phase spectrum.
Measurements Spectrum, power spectral density, time record
and 1/3 octave.
Analysis Band, sideband, total harmonic distortion and trace
math.
Graphic Expand Display expands up to 50x about any point in
the display.
MARKER FUNCTIONS
Harmonic Marker Displays up to 400 harmonics of the fundamental.
Delta Marker Reads amplitude and frequency relative to
defined reference.
Next Peak/Harmonic Locates nearest peak or harmonic to the
left or right.
Data Tables Lists Y values of up to 200 user defined X points.
Limit Tables Automatically detects data exceeding up to 100
user defined upper and
lower limit trace segments.
GENERAL
Monitor Monochrome CRT. 640H by 480V resolution.
Adjustable brightness and screen position.
Interfaces IEEE-488, RS232 and Printer interfaces standard.
All instrument functions can be controlled through the
IEEE-488 and RS232
interfaces. A PC keyboard input is provided for additional
flexibility.
Hardcopy Screen dumps and table and setting listings to dot
matrix and HP LaserJet
compatible printers. Data plots to HP-GL compatible plotters
(via RS232 or
IEEE-488).
Disk 3.5 inch DOS compatible format, 720 kbyte capacity.
Storage of data,
setups, data tables, and limit tables.
Power 60 Watts, 100/120/220/240 VAC, 50/60 Hz.
Dimensions 17"W x 6.25"H x 18.5"D
Weight 36 lbs.
Warranty One year parts and labor on materials and workmanship.
1 Manual
User manual
Manual type:
User manual
Pages:
221
Size:
4.7 MB
Language:
english
Revision:
1.7
Manual-ID:
Date:
March 2006
Quality:
Electronic document, no scan, very well readable.
Upload date:
Jan. 1, 2017
MD5:
caeb73d1-2ad7-4f7b-dca7-d1f7b6992c8f
Downloads:
422